Return on capital employed (ROCE)1
4.1%
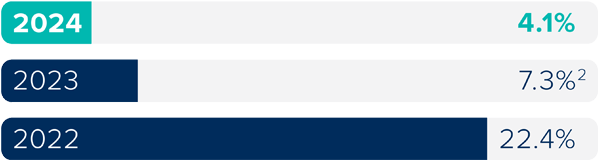
Definition
Adjusted operating profit before joint ventures divided by average capital employed.
Why we measure
Illustrates how effective the Group’s capital allocation is in delivering returns.
Earnings before interest and tax (EBIT) margin1
5.1%
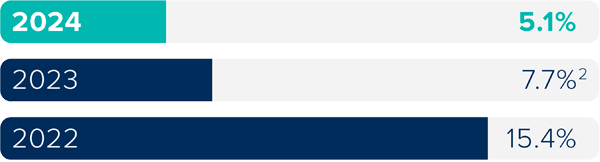
Definition
EBIT margin (operating profit margin) reflects the adjusted profit before interest, joint ventures and tax achieved by the Group, divided by revenue.
Why we measure
Assesses the financial efficiency of our Group operations before any one-off costs.
Unit completions
1,873
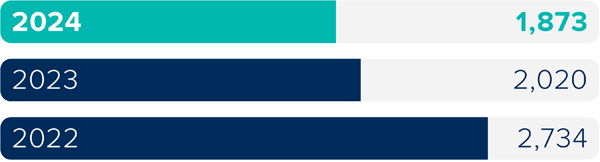
Definition
Sales of homes recognised in the year including 100% of those held in joint ventures and on an equivalent unit basis.
Why we measure
Reflects overall business activity and output and enables us to forecast future capacity requirements.
Land creditors as a % of net assets1
18.1%
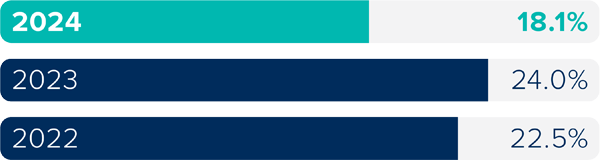
Definition
Land creditors divided by net assets.
Why we measure
Ensures that the Group is maintaining its financial position when entering into future land commitments.
Net (debt)/cash1
£(8.5)m
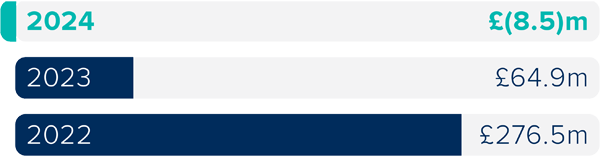
Definition
Cash and cash-equivalents plus non-current and current interest-bearing loans and borrowings.
Why we measure
Illustrates the Group’s overall liquidity position and general financial resilience.
Land portfolio forecast gross margin
23.1%
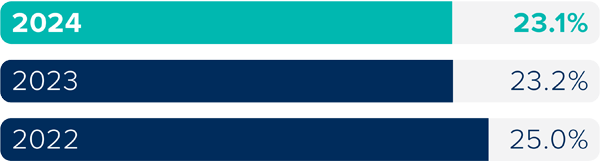
Definition
The forecast gross margin after sales and marketing costs of land we hold in our short-term land portfolio.
Why we measure
Indicates the earnings potential of current and future land development and the sale of associated homes.
1 ROCE, EBIT margin, net debt/cash and land creditors as a percentage of net assets are alternative performance measures. See pages 158-159 of the 2024 Annual Report and Accounts for further details.
2 Represented as per note 29 of the financial statements within the 2024 Annual Report and Accounts.